FrontierChallenge evaluates whether frontier agent systems can carry a specified scientific task from fixed inputs to a complete, checkable handoff. Across 97 released workflows in six scientific domains, it scores the entire artifact bundle—not only a final answer—revealing how often strong partial progress still falls short of complete scientific delivery. TRACES process scores correlate strongly with task outcomes, supporting FrontierChallenge as a benchmark of discoverative AI capabilities.
Pass Rate
Rank | Model | Agent scaffold | Pass Rate |
|---|---|---|---|
1 | GPT-5.6 Sol | Codex | 20.6% |
2 | Grok 4.6 | Claude Code | 20.6% |
3 | Kimi K3 | Claude Code | 17.5% |
4 | Claude Opus 5 | Claude Code | 17.5% |
5 | GPT-5.6 Terra (max) | Codex | 15.5% |
6 | Qwen 3.8 Max | Claude Code | 15.5% |
7 | DeepSeek V4 Pro-0813 | Claude Code | 13.4% |
8 | DeepSeek V4 Flash-0731 | Claude Code | 12.4% |
9 | Apodex 1.1 | Frontier Agent (Agent Team) | 12.4% |
10 | Gemini 3.7 Flash | Claude Code | 10.3% |
11 | Apodex 1.1 | Claude Code | 10.3% |
12 | Qwen3.5-397B-A17B | Claude Code | 4.1% |
13 | GLM-5.2 | Claude Code | 3.1% |
97 workflows across six scientific domains
FrontierChallenge was built from scientific and engineering work that resembles professional practice: analysis, computation, simulation, and research delivery. The collection favors tasks that require domain knowledge, specialist software, interdependent steps, and outputs that can be checked—not expanded question answering or isolated coding exercises.
The full collection contains 300 workflows. This study publicly releases and evaluates 97 tasks across 21 workflow families: 20 in quantum chemistry, 16 in molecular dynamics, 22 in materials characterization, 23 in analytical chemistry, 10 in life science, and 6 in electrochemistry/environment. Of the released tasks, 74 are Hard and 23 are Medium.
The 97 released tasks were randomly selected from the portion of the collection whose official evaluation does not require GPUs. The remaining 203 form an internal held-out set, which also includes workflows with GPU-dependent evaluation. The six domains describe this release; they are not balanced samples of their scientific fields and should not be read as a ranking of which disciplines are intrinsically harder.

The 97 released tasks span six domains and 21 workflow families.
Why this leaderboard matters
Language models are becoming agents that can plan, call tools, execute code, and modify persistent files. In science, that changes what success means. A plausible conclusion is not enough: a system may need to inspect heterogeneous inputs, choose and run an analysis, validate intermediate results, and produce mutually consistent code, tables, figures, and prose.
Existing benchmarks measure important capabilities such as expert knowledge, tool use, software interaction, code repair, paper replication, and scientific data analysis. But their unit of evaluation is often a final answer, an interaction trace, a single program, or a workflow from one discipline. Those settings do not fully show whether an agent can carry a heterogeneous scientific task through several dependent analytical stages and deliver everything the task requires.
FrontierChallenge asks a focused question: given a specified scientific task and fixed data, can an agent independently complete the workflow from input processing to final deliverables and satisfy the complete task contract? It is deliberately narrower than autonomous science. The agent does not choose the research question; the objective, inputs, and required outputs are fixed so that execution can be compared consistently.
Each task is judged on the complete submitted artifact bundle rather than a single answer. Required files must be present, intermediate and final results must agree, and the handoff must be inspectable and reproducible. The leaderboard therefore ranks systems by strict Pass Rate, while average score records partial progress separately. This distinction exposes systems that appear close—or confidently claim completion—but still fail to deliver a scientifically usable result.
What one task actually contains
Every task is packaged as a self-contained scientific assignment with five aligned parts: a defined objective, fixed input data and context, an execution environment with the relevant software, an explicit output contract, and an evaluation procedure. Depending on the workflow, the required handoff may include a report, structured tables, diagnostic figures, executable analysis code, simulation products, or several artifacts that must agree with one another.
Each package also contains task metadata, agent-facing instructions, reference material, a stepwise scoring rubric, an executable Grader, and the documentation needed to reproduce scoring. Agent-visible material is kept separate from evaluator-side references. This makes the task repeatable while preventing the system from seeing the expected result.
Tasks entered the benchmark only if they were representative of plausible work, complex enough to require a dependency-aware workflow, diverse rather than template variants, and verifiable through files, numerical checks, or explicit acceptance criteria. Tasks based on isolated facts, single operations, purely subjective outputs, or incomplete evaluation materials were excluded.
How complete delivery is measured
The experiments evaluate twelve frontier models with three agent scaffolds: Codex, Claude Code, and Frontier Agent. The leaderboard contains thirteen rows because Apodex 1.1 is evaluated with two different scaffolds. Each row is therefore a model–scaffold system, not a model in isolation, and every system receives the same 97 task objectives and agent-visible inputs.
A task-specific Grader checks the required files, numerical results, formats, figures, executable code, and consistency across artifacts. When a rubric includes a semantic judgment, that criterion is evaluated three times and averaged. A task counts as a full pass only when its score reaches 99.9 out of 100; the small tolerance absorbs numerical variation from averaging those Judge assessments and does not waive any task requirement.
Pass Rate is the primary metric: the share of tasks for which the complete contract is satisfied. Average Score records partial completion across the task rubrics. Both are useful, but they answer different questions. Average Score shows how much of the requested work was done; Pass Rate shows how often the final bundle was actually complete.
The central result: progress is not completion
Across the evaluated systems, Average Score ranged from 67.5 to 87.9, while strict Pass Rate ranged from only 3.1% to 20.6%. Eight systems averaged above 80 points, yet none completed more than 20 of the 97 tasks. The benchmark therefore reveals a large gap that an average score alone can hide: many submissions contain substantial correct work but still miss at least one requirement needed for an acceptable scientific handoff.
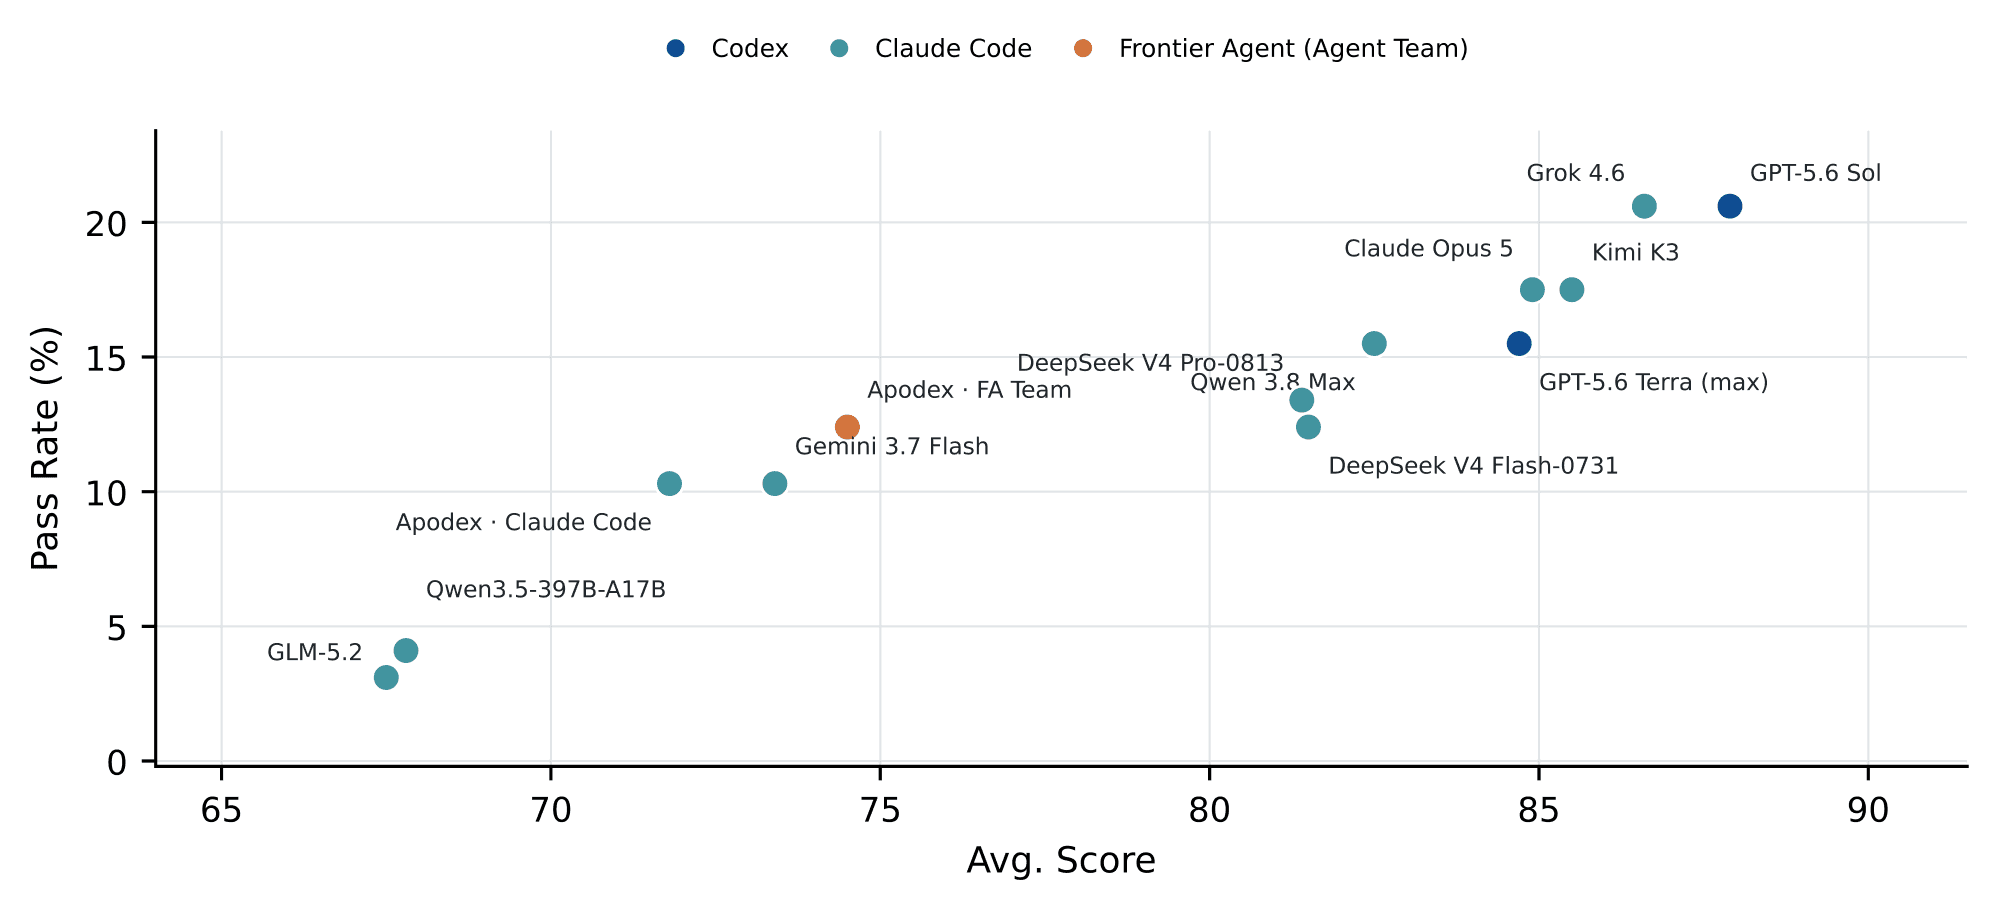
Average score versus complete workflow Pass Rate across the evaluated systems.
GPT-5.6 Sol with Codex achieved the highest Average Score, 87.9, and shared the top Pass Rate of 20.6% with Grok 4.6 using Claude Code. Grok 4.6 averaged 86.6. Kimi K3 and Claude Opus 5, both with Claude Code, each passed 17.5% of tasks, while GPT-5.6 Terra (max) with Codex passed 15.5%.
The two Apodex 1.1 rows illustrate why the scaffold belongs in the leaderboard. Frontier Agent in the Agent Team configuration reached a 74.5 Average Score and 12.4% Pass Rate, compared with 71.8 and 10.3% under Claude Code. This is a useful descriptive comparison, but it is not a controlled estimate of the scaffold’s causal effect.
TRACES: the capabilities behind scientific workflow completion
Following the TRACES framework introduced in Apodex Discovery, we assess how agents carry out scientific workflows using 1,164 frozen trajectories from 12 model–scaffold configurations across 97 tasks. TRACES evaluates six capabilities from recorded actions and their results: Coherence tracks the workflow and consistency across outputs; Evidence connects reported results to executed work; Alternatives assesses hypothesis and method management; Scope examines boundary checks and failure reasoning; Tools assesses execution and reproducibility; and Repair assesses diagnosis and correction of failures.
Scores use a 1–4 base scale with a coverage adjustment: the mean score of graded, integrity-gate-passing runs is multiplied by the square root of their share of available runs. Capabilities are scored where applicable.
Coverage-adjusted TRACES scores. Higher is better.
Model | Scaffold | TRACES | Coherence | Evidence | Alternatives | Scope | Tools | Repair |
|---|---|---|---|---|---|---|---|---|
Claude Opus 5 | Claude Code | 3.768 | 3.890 | 3.951 | 3.823 | 3.508 | 3.704 | 3.653 |
GPT-5.6 Sol | Codex | 3.670 | 3.874 | 3.919 | 3.431 | 3.341 | 3.641 | 3.533 |
Qwen 3.8 Max | Claude Code | 3.624 | 3.845 | 3.842 | 3.472 | 3.186 | 3.601 | 3.607 |
GPT-5.6 Terra (max) | Codex | 3.612 | 3.818 | 3.876 | 3.413 | 3.184 | 3.582 | 3.560 |
Grok 4.6 | Claude Code | 3.562 | 3.777 | 3.853 | 3.436 | 3.196 | 3.523 | 3.338 |
DeepSeek V4 Pro-0813 | Claude Code | 3.536 | 3.787 | 3.857 | 3.367 | 3.003 | 3.536 | 3.427 |
DeepSeek V4 Flash-0731 | Claude Code | 3.506 | 3.774 | 3.767 | 3.226 | 3.056 | 3.488 | 3.434 |
Kimi K3 | Claude Code | 3.496 | 3.776 | 3.815 | 3.316 | 2.996 | 3.523 | 3.252 |
Apodex 1.1 | Claude Code | 3.293 | 3.460 | 3.544 | 3.262 | 2.853 | 3.304 | 3.300 |
GLM-5.2 | Claude Code | 3.152 | 3.302 | 3.532 | 3.176 | 2.652 | 3.232 | 2.950 |
Gemini 3.7 Flash | Claude Code | 3.016 | 3.258 | 3.451 | 2.854 | 2.438 | 3.098 | 2.499 |
Qwen3.5-397B-A17B | Claude Code | 2.643 | 2.822 | 2.998 | 2.341 | 2.185 | 2.683 | 2.410 |
The TRACES ranking aligns closely with the task-outcome ranking. Across the 12 configurations, TRACES correlates strongly with Average Score (Pearson r = 0.874; Spearman ρ = 0.762) and Pass Rate (r = 0.828; ρ = 0.799). Within-task analysis gives the same direction: across 94 eligible tasks, the mean Pearson correlation between process score and task score is 0.475, with positive correlations on 85% of tasks. Together, these results support FrontierChallenge as a substantive test of discoverative AI capabilities through scientific workflow execution and delivery.
Claude Opus 5 leads with an TRACES score of 3.768, followed by GPT-5.6 Sol (3.670), Qwen 3.8 Max (3.624), and GPT-5.6 Terra (3.612). Evidence is the highest or nearly highest dimension for every configuration; Scope is consistently the lowest, making boundary checks and failure reasoning a shared priority. Apodex 1.1 with Claude Code scores 3.293, above Qwen3.5-397B-A17B (2.643), GLM-5.2 (3.152), and Gemini 3.7 Flash (3.016), but below Kimi K3 (3.496) and DeepSeek V4 Flash-0731 (3.506). Its largest gaps to Claude Opus 5 are in Scope (2.853 vs. 3.508) and Alternatives (3.262 vs. 3.823), pointing to boundary/failure reasoning and hypothesis management as clear targets for improvement.
Aggregate rank is only part of the story
Completion varied sharply across domains. The highest Pass Rates appeared in quantum chemistry and molecular dynamics. Grok 4.6 with Claude Code completed 60% of quantum-chemistry tasks; GPT-5.6 Sol with Codex and Claude Opus 5 with Claude Code each reached 55%. In molecular dynamics, GPT-5.6 Sol, GPT-5.6 Terra (max), and Grok 4.6 each reached 38%.
The separation between partial progress and complete delivery was much stronger elsewhere. Materials characterization reached an Average Score of 88.1, but no system passed more than 9% of its tasks. Analytical chemistry reached 87.6, yet only DeepSeek V4 Pro-0813 completed any task in that domain, for a best Pass Rate of 4%. Electrochemistry/environment reached an Average Score of 94.9 while every system recorded a 0% Pass Rate.
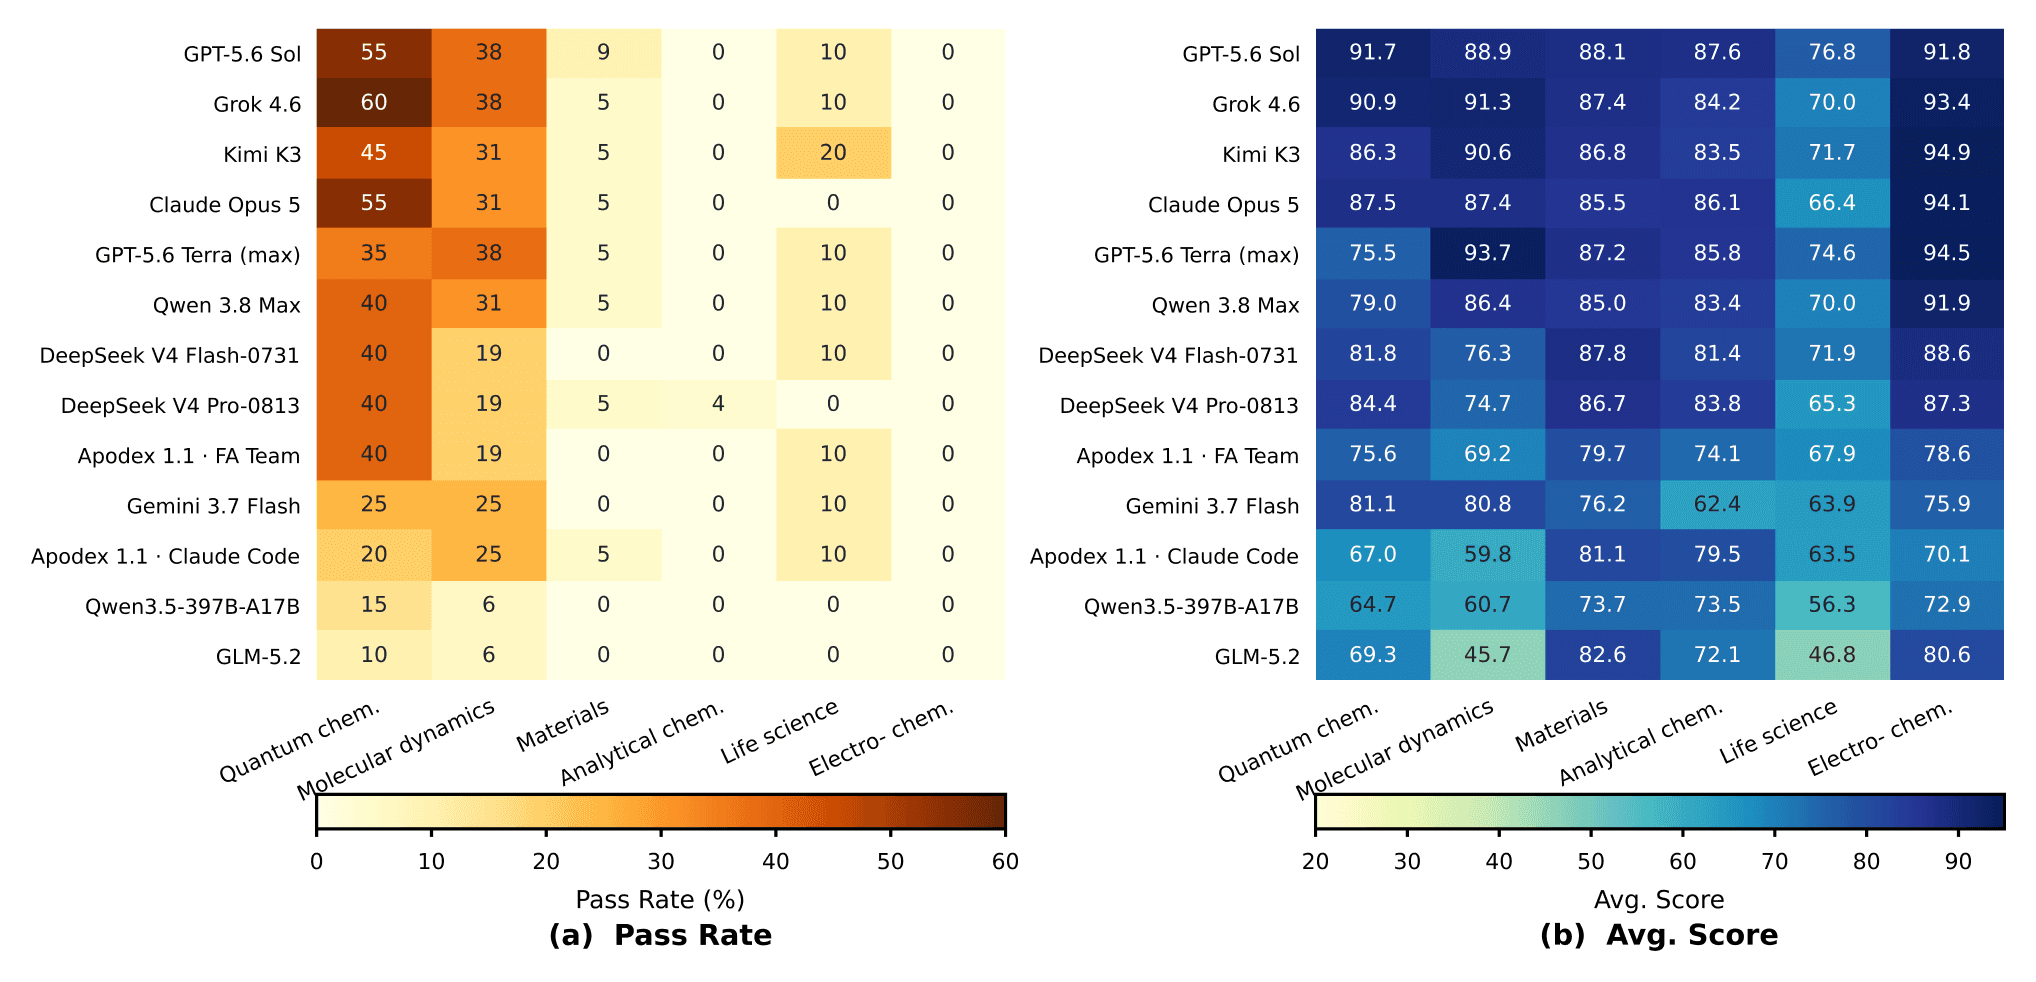
Performance varies substantially across the six scientific domains.
These differences identify where complete delivery broke down in this released suite; they do not establish that one scientific field is inherently harder than another. The domain slices differ in task composition, software, deliverable contracts, and Grader structure. They also show why users should look beyond the overall order when choosing a system for a particular kind of scientific work.
What incomplete handoffs look like
Artifact shortfalls dominate many recorded failures. Judge-assessed shortfalls appeared in 97% of non-passing materials-characterization submissions, 95% in analytical chemistry, and 85% in electrochemistry/environment, compared with 43% in quantum chemistry. These signals can overlap and reflect differences in task contracts and evaluation paths.
“Done” is not evidence. Among 849 non-passing Claude Code trajectories, 641—75.5%—ended with language claiming or implying completion. Only 1.5% explicitly said the work was still running, waiting, or in progress. A final status message is therefore a poor substitute for inspecting the submitted artifacts.
Tool errors are not failure by themselves. At least one raw tool error appeared in 80.7% of non-passing Claude Code trajectories and 94.2% of passing ones. Successful systems can encounter and recover from errors; what matters is whether the final contract is satisfied.
The analysis describes observable boundaries in the recorded runs; it does not assign a single root cause to each failure. The failure signatures may co-occur, and trajectory-level comparisons are limited to Claude Code because equivalent common-schema logs were not available for the other scaffolds.
Resource profiles varied widely
Among the twelve systems with token records, reported input use varied by more than sixfold: from 2.183 million tokens per task for Grok 4.6 with Claude Code to 13.730 million for Apodex 1.1 with Claude Code. GPT-5.6 Sol reported 6.327 million input tokens and 23.1 thousand output tokens per task; GPT-5.6 Terra (max) reported 7.039 million input tokens and 38.6 thousand output tokens.
Observed mean execution time ranged from 21.8 to 112.8 minutes per task and often had a long tail. Frontier Agent in the Agent Team configuration had a mean of 112.8 minutes, a median of 54.9, and a 90th percentile of 272.2 minutes. These figures describe complete observed runs—not isolated model latency. Tool execution, retries, caching, scaffold behavior, provider conditions, and reporting conventions all contribute to the totals.
How to read the leaderboard responsibly
The ranking is a snapshot of specified systems on this released task set. Most models were evaluated with one scaffold, and each system has one recorded trajectory per task. Small numerical differences should therefore not be treated as statistically resolved rankings, and the results do not measure run-to-run variability.
Reported token use and elapsed time also combine model behavior, scaffold behavior, tool execution, retries, caching, provider conventions, and service conditions. They describe observed resource profiles, not hardware-normalized efficiency, energy use, or isolated model speed.
Finally, FrontierChallenge evaluates execution after the scientific objective, inputs, and acceptance procedure have been specified. It does not measure agenda setting, hypothesis generation, unconstrained discovery, or the fraction of a scientist’s job that can be automated.
A distinct capability remains unresolved
Frontier systems can already make meaningful progress on complex scientific work. What they do not yet provide reliably is the complete handoff: every required artifact present, every dependency resolved, every result mutually consistent, and enough evidence for another scientist to inspect or reproduce the work.
That is why this leaderboard centers strict completion. More reliable scientific agents will need explicit tracking of the task contract, validation across files and results, recovery from tool failures, and evidence-based checks before they declare the work finished.
FrontierChallenge connects complete scientific delivery with the discoverative AI capabilities that make it possible.